

Turning an existing webapp into a webapp plugin component#
In this tutorial, we’ll start from the webapp created in the Bokeh webapp tutorial to create a webapp plugin. The aim is to have a ready-to-use bar chart webapp in an order context with a boolean validating or not the presence of the category.
Converting to a webapp plugin#
Click the Actions button on your web app to open the right panel.
Click Plugin to convert it to a plugin webapp.
Choose either your existing dev plugin or create a new one as the target plugin.
Give the webapp an identifier like
custom-orders-barchart.Click Convert.
Confirm the overwrite of existing sources, if necessary.
Editing the definitions in webapp.json#
First, let’s examine the webapp.json file. This file describes the parameters that the user must specify when using the plugin webapp.
Note that unlike the recipe.json file of a plugin recipe (see that tutorial),
there are no input_roles or output_roles sections,
and we can focus on editing the "params" section, which comprises the input dataset,
the category column, the boolean column, and the total amount of orders column defined as follow:
Thinking about the parameters to specify, there’s:
the input dataset
the category column
the boolean column
the total amount of orders column
... which can be specified in the JSON as follows.
"params": [
    {
        "name": "input_dataset",
        "type": "DATASET",
        "label": "Dataset",
        "description": "The dataset used to populate the webapp",
        "mandatory": true,
        "canSelectForeign": true
    },
    {
        "name": "category",
        "type": "DATASET_COLUMN",
        "datasetParamName": "input_dataset",
        "label": "Category Column",
        "description": "",
        "mandatory": true
    },
    {
        "name": "boolean",
        "type": "DATASET_COLUMN",
        "datasetParamName": "input_dataset",
        "label": "Boolean Column",
        "description": "",
        "mandatory": true
    },
    {
        "name": "total_amount",
        "type": "DATASET_COLUMN",
        "datasetParamName": "input_dataset",
        "label": "Total Amount Column",
        "description": "",
        "mandatory": true
    }
],
After doing that, uncomment the roles section.
"roles": [
    {"type": "DATASET", "targetParamsKey": "input_dataset"}
]
Editing the code in backend.py#
Now, let’s edit backend.py. The default contents include the code from your Python Bokeh webapp.
You can retrieve the parameter’s value from the map of parameters previously defined
with the get_webapp_config() function, such as:
input_dataset = get_webapp_config()['input_dataset']
category = get_webapp_config()['category']
campaign = get_webapp_config()['boolean']
total_amount = get_webapp_config()['total_amount']
Then, use them as variables inside your code if needed.
For example, in the application function code block:
def application():
"""
Create the application.
"""

# RETRIEVE VALUES
input_dataset = get_webapp_config()['input_dataset']
boolean = get_webapp_config()['boolean']

# READ DATASET
dataset = dataiku.Dataset(input_dataset)
df = dataset.get_dataframe()
# Only keep data where the campaign has been launched
df = df[df[boolean]]
Once you have finished updating the code, don’t forget to save your change.
Note
A webapp plugin allows you to use a single code for several use cases if the data is similar for each context. However, titles and other labels will remain hard-coded, which limits generalization to a more advanced and detailed webapp.
Provisioning the plugin with a code environment#
You’ll need to configure your plugin and specify the code environment with Bokeh directly in the plugin and not in the webapp. To do so:
Navigate to the Summary tab.
Click + Create a new code environment and choose Python.
Back in the Edit tab, select the requirements.txt file under code-env > python > spec
Enter
bokeh.Click Save All
Navigate back to the Summary tab and click Build New Environment.
Using your custom webapp in a project#
Let’s access the input Dataiku dataset as a pandas dataframe and extract the relevant columns from the pandas dataframe to define the source data for the visualization.
Note
After editing webapp.json for a plugin webapp, you must do the following:
On the top right corner, click Actions > Reload this plugin.
Reload the Dataiku page in your browser (
Ctrl+r/Cmd+r).
When modifying the backend.py file, you don’t need to reload anything. Restart the webapp backend.
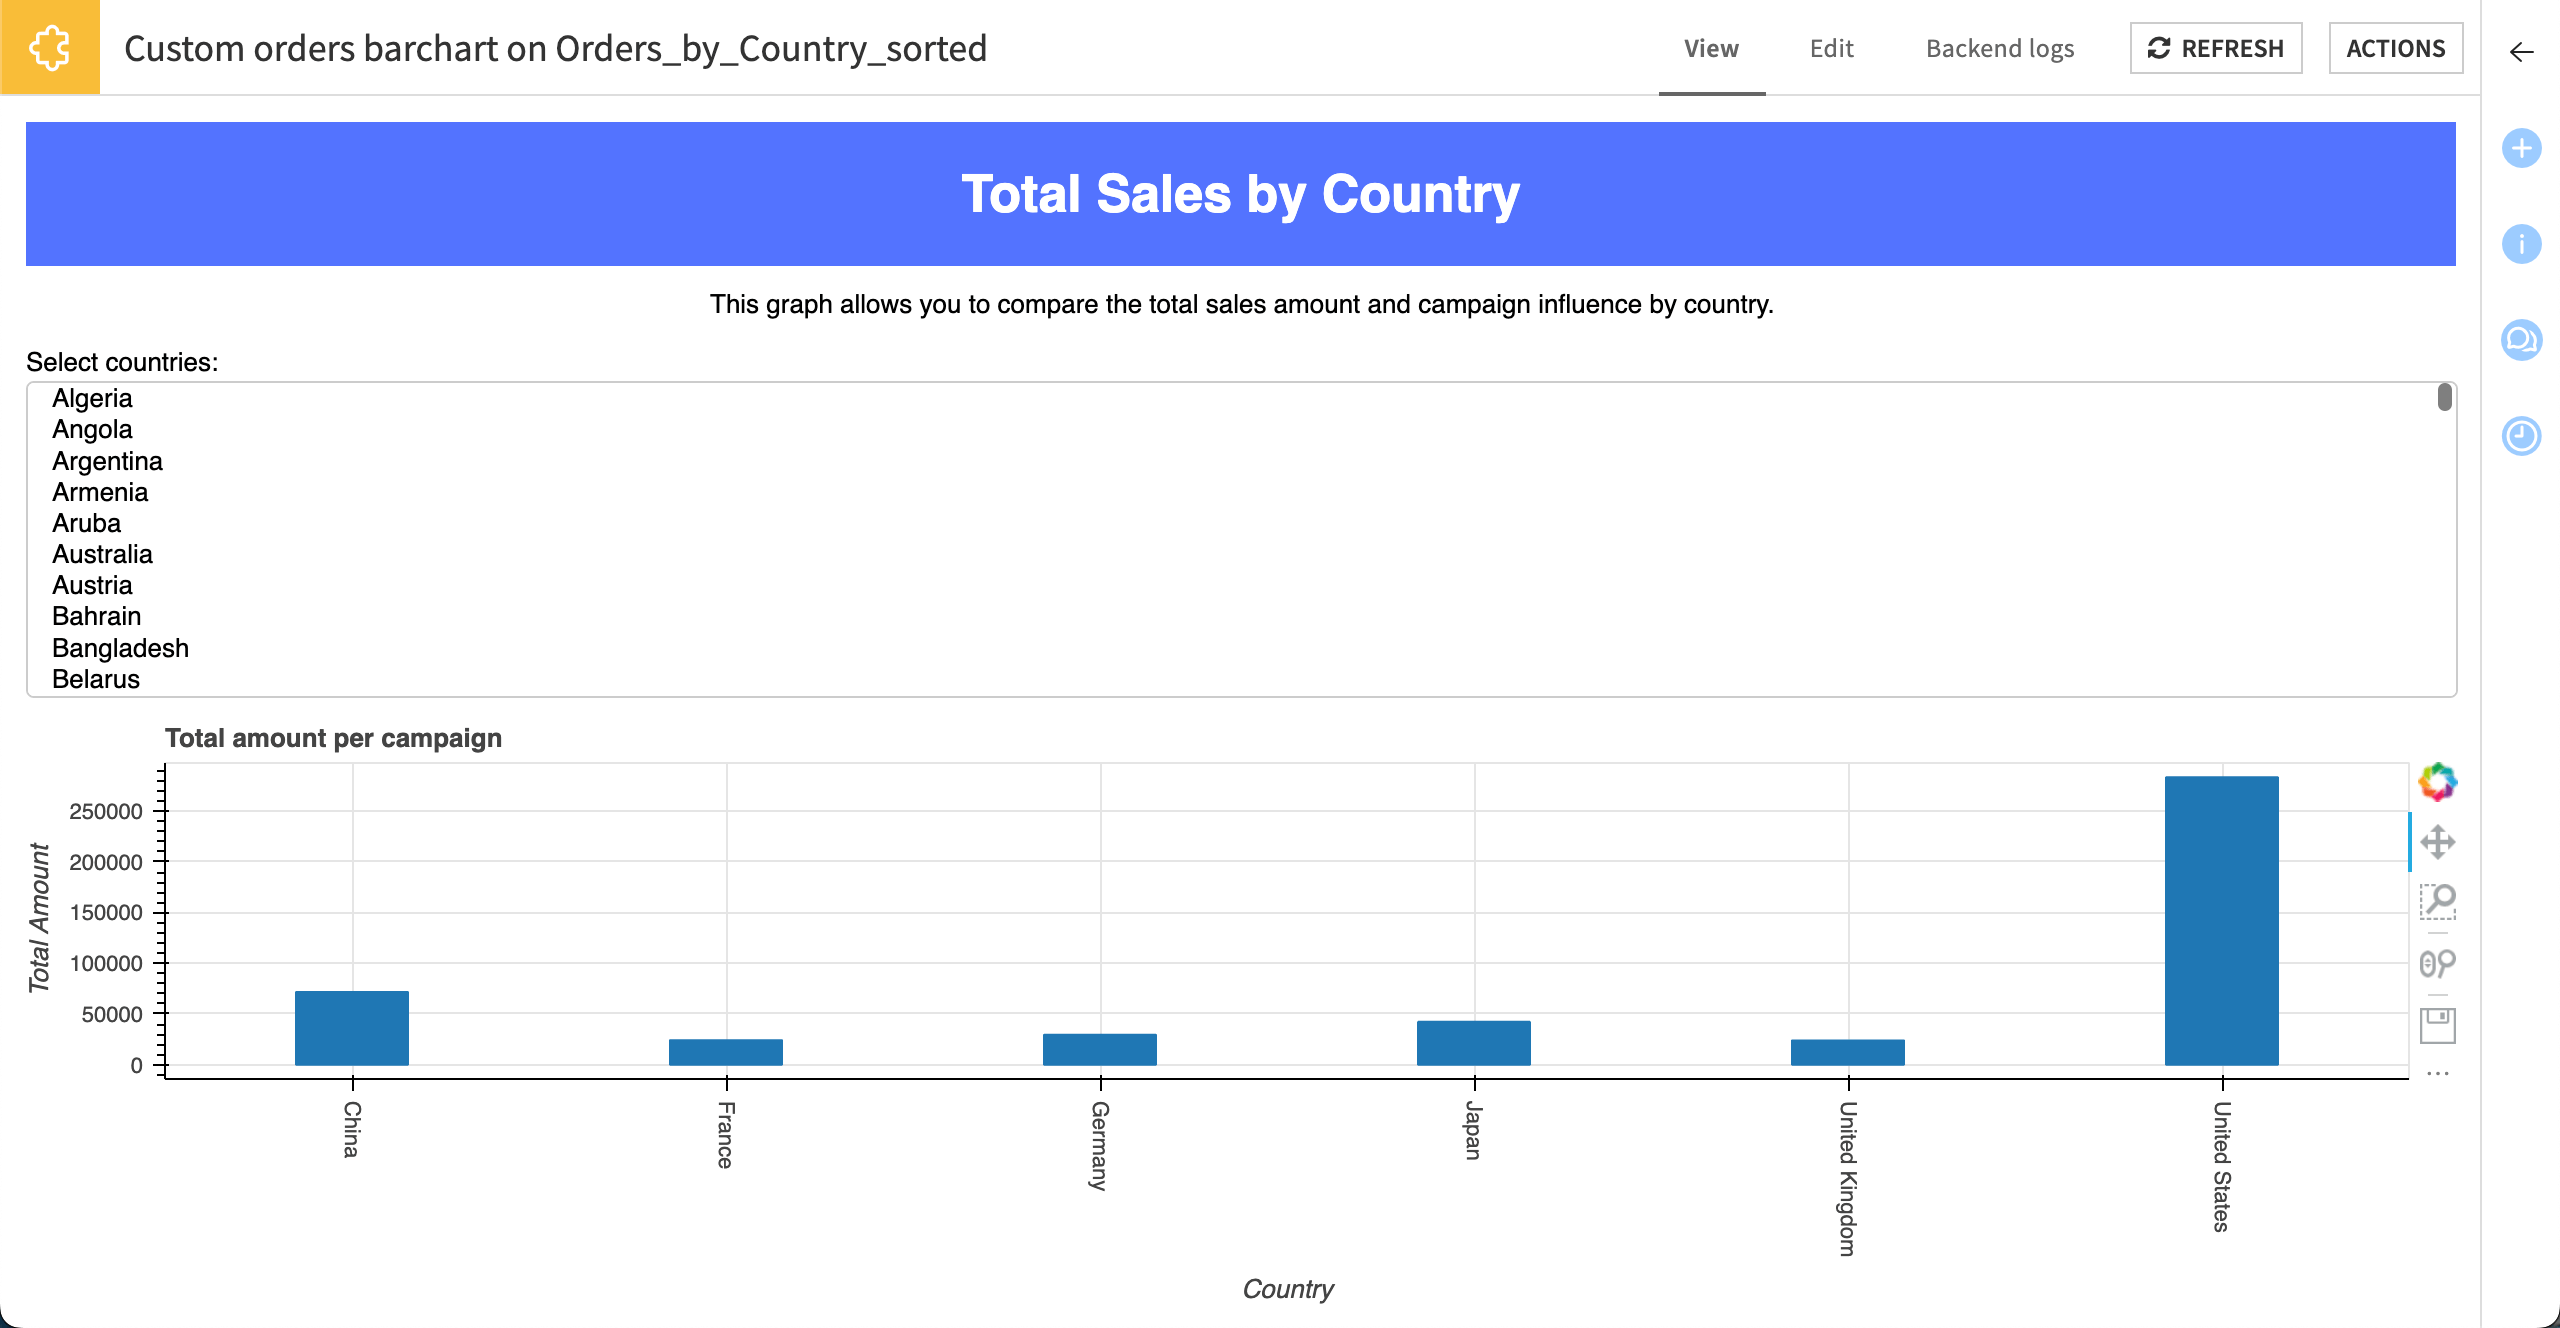
Go to the Flow and select a dataset, such as Orders_by_Country_sorted.
From the Actions sidebar, select your plugin webapp.
Give the new webapp a name (or accept the default) and click Create.
In the Edit tab, make the desired selections for displaying the webapp.
Click Save and View Webapp.
The webapp displays the selected settings and provides interactivity to change the plot title, the time period to display, and the category of the categorical column.
To change the dataset and columns the webapp uses, go to the Edit tab, make the new selections, and click View webapp.
Wrapping Up#
You have leveraged the power of a webapp into a reusable plugin for further use. Here is the complete version of code used during this tutorial.
backend.py
from dataiku.customwebapp import *

# Access the parameters that end-users filled in using webapp config
# For example, for a parameter called "input_dataset"
# input_dataset = get_webapp_config()["input_dataset"]

import dataiku
from bokeh.io import curdoc
from bokeh.models import Div, MultiSelect, ColumnDataSource, FactorRange
from bokeh.plotting import figure
from functools import partial
from bokeh.layouts import layout


def add_title():
    """
    Create the title for the application.
    :return: The title object.
    """
    title = Div(text="""<h1>Total Sales by Country</h1>""",
                style={'backgroundColor': '#5473FF',
                       'color': '#FFFFFF',
                       'width': '98vw',
                       'margin': 'auto',
                       'textAlign': 'center'})
    return title


def add_text():
    """
    Create a description of the application.
    :return: The text object.
    """
    text = Div(text="This graph allows you to compare the total sales amount and campaign influence by country.",
               sizing_mode="stretch_width",
               align="center")
    return text

def add_plot(df, source):
    """
    Create a plot for rendering the selection
    :param df: The dataframe to use.
    :param source: The columnSource to use.
    :return: The plot object.
    """
    category = get_webapp_config()['category']

    plot = figure(plot_width=600, plot_height=300,
                  x_axis_label='Country',
                  y_axis_label='Total Amount',
                  title='Total amount per campaign',
                  x_range=FactorRange(factors=list(df[category])),
                  sizing_mode='stretch_width'
                  )
    plot.left[0].formatter.use_scientific = False
    plot.xaxis.major_label_orientation = "vertical"
    plot.vbar(source=source, x='x', top='y', bottom=0, width=0.3)

    return plot

def add_select(df, source, plot):
    """
    Create a Multi-select for the country selection.
    :param df: The dataframe to use.
    :param source: The columnSource to use.
    :param plot: The plot to update.
    :return: The multi-select object.
    """
    category = get_webapp_config()['category']

    select = MultiSelect(title="Select countries:",
                         options=[i for i in sorted(df[category].unique())],
                         value=['United States', 'China', 'Japan', 'Germany', 'France', 'United Kingdom'],
                         size=10,
                         sizing_mode='stretch_width'
                         )
    select.on_change("value", partial(update_fig, df=df, source=source, plot=plot))
    return select

def update_fig(_attr, _old, new, df, source, plot):
    """
    Callback for updating the plot with the new values.
    :param _attr: Unused: the attribute that is changed.
    :param _old: Unused: the old value.
    :param new: The new value.
    :param df: The dataframe to use.
    :param source: The columnSource to use.
    :param plot: The plot to update.
    """

    category = get_webapp_config()['category']
    total_amount = get_webapp_config()['total_amount']

    data = df[df[category].isin(new)]
    source.data = dict(
        x=data[category],
        y=data[total_amount]
    )
    plot.x_range.factors = list(source.data['x'])


def application():
    """
    Create the application.
    """

    # RETRIEVE VALUES
    input_dataset = get_webapp_config()['input_dataset']
    boolean = get_webapp_config()['boolean']

    # READ DATASET
    dataset = dataiku.Dataset(input_dataset)
    df = dataset.get_dataframe()
    # Only keep data where the campaign has been launched
    df = df[df[boolean]]

    source = ColumnDataSource(dict(x=[], y=[]))

    title = add_title()
    text = add_text()
    plot = add_plot(df, source)
    select = add_select(df, source, plot)

    update_fig("", "", select.value, df, source, plot)

    app = layout([title, text, select, plot])
    curdoc().add_root(app)

application()
webapp.json
// This file is the descriptor for webapp custom-orders-barchart
{
    "meta": {
        // label: name of the webapp as displayed, should be short
        "label": "Custom orders barchart",
        // description: longer string to help end users understand what this webapp does
        "description": "",
        // icon: must be one of the FontAwesome 3.2.1 icons, complete list here at https://fontawesome.com/v3.2.1/icons/
        "icon": "icon-puzzle-piece"
    },

    "baseType": "BOKEH", // WARNING: do not change
    "hasBackend": "true",
    "noJSSecurity": "true",
    "standardWebAppLibraries": null,

    /* The field "params" holds a list of all the params
       for wich the user will be prompted for values in the Settings tab of the webapp.

       The available parameter types include:
       STRING, STRINGS, INT, DOUBLE, BOOLEAN, SELECT, MULTISELECT, MAP, TEXTAREA, PRESET, DATASET, DATASET_COLUMN, MANAGED_FOLDER

       For the full list and for more details, see the documentation: https://doc.dataiku.com/dss/latest/plugins/reference/params.html
    */
       "params": [
        {
            "name": "input_dataset",
            "type": "DATASET",
            "label": "Dataset",
            "description": "The dataset used to populate the webapp",
            "mandatory": true,
            "canSelectForeign": true
        },
        {
            "name": "category",
            "type": "DATASET_COLUMN",
            "datasetParamName": "input_dataset",
            "label": "Category Column",
            "description": "",
            "mandatory": true
        },
        {
            "name": "boolean",
            "type": "DATASET_COLUMN",
            "datasetParamName": "input_dataset",
            "label": "Boolean Column",
            "description": "",
            "mandatory": true
        },
        {
            "name": "total_amount",
            "type": "DATASET_COLUMN",
            "datasetParamName": "input_dataset",
            "label": "Total Amount Column",
            "description": "",
            "mandatory": true
        }
    ],

    "roles": [
        {"type": "DATASET", "targetParamsKey": "input_dataset"}
    ]
}