

Writing a custom recipe to remove outliers from a dataset#
Prerequisites#
Dataiku >= 11.0
“Develop plugins” permission
A Python code environment with
scikit-learnpackages installed (see the documentation for more details) if you want to be able to load the dataset from the code.
This tutorial was written with Python 3.9 and with the package scikit-learn==1.2.2.
Context#
A dataset can sometimes be polluted by a fraction of irrelevant values called outliers. These outliers may wrongly skew the dataset’s statistical distribution and lead to false interpretations, so they must be addressed. One solution is to clip them by capping their value to the boundaries of a user-defined interval. For example, if an interval of [0, 1] is defined, any value lower than 0 becomes 0, and any value greater than 1 becomes 1. As there is no visual recipe in Dataiku to do this processing, this tutorial aims at packaging the relevant code into a custom recipe plugin component to be made available to non-coder users of the instance.
The iris dataset consists of 3 types of irises’ (Setosa, Versicolour, and Virginica) petal and sepal length, stored in a 150x4 numpy.ndarray. A quick analysis of this dataset, with a boxplot, produces the plot shown in Fig. 1.
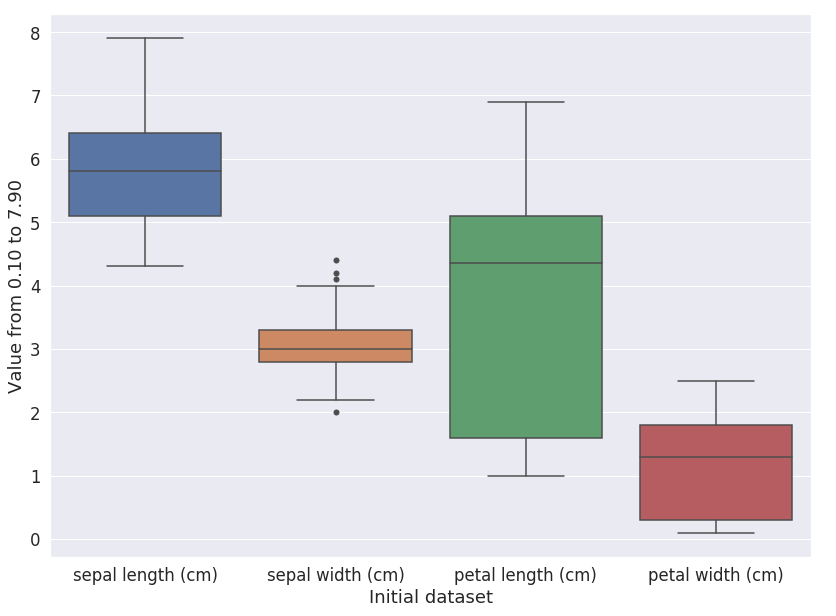
Figure 1: Analysis of the iris dataset.#
This plot shows that some values can be considered outliers for the “Sepal width” feature so we will clip them. Code 1 is an example of how we can clip values.
import dataiku
from dataiku import pandasutils as pdu
import pandas as pd
import warnings
from sklearn import datasets
warnings.filterwarnings("ignore")

iris = datasets.load_iris()
df = pd.DataFrame(data= np.c_[iris['data']],
                     columns= iris['feature_names'])

# Column where to clip
column_name = "sepal width (cm)"

# Compute the quantile and IQR
Q1 = df[column_name].quantile(0.25)
Q3 = df[column_name].quantile(0.75)
IQR = 1.5 * (Q3 - Q1)
lower = Q1 - IQR
upper = Q3 + IQR

# Clip values
df[column_name] = df[column_name].clip(lower=lower, upper=upper)
Running Code 1 will produce a clipped dataset, as shown in Fig. 2. In Code 1, we used the interquartile range (IQR) method to measure the dispersion of the data and use a coefficient to detect outliers. For example, applied to the iris dataset, values greater than 4.05 have been replaced by 4.05, affecting three rows where values were 4.4, 4.1, and 4.2. We also replace the value 2.0 with the value 2.05. Depending on the use case, we could clip or remove the outliers.
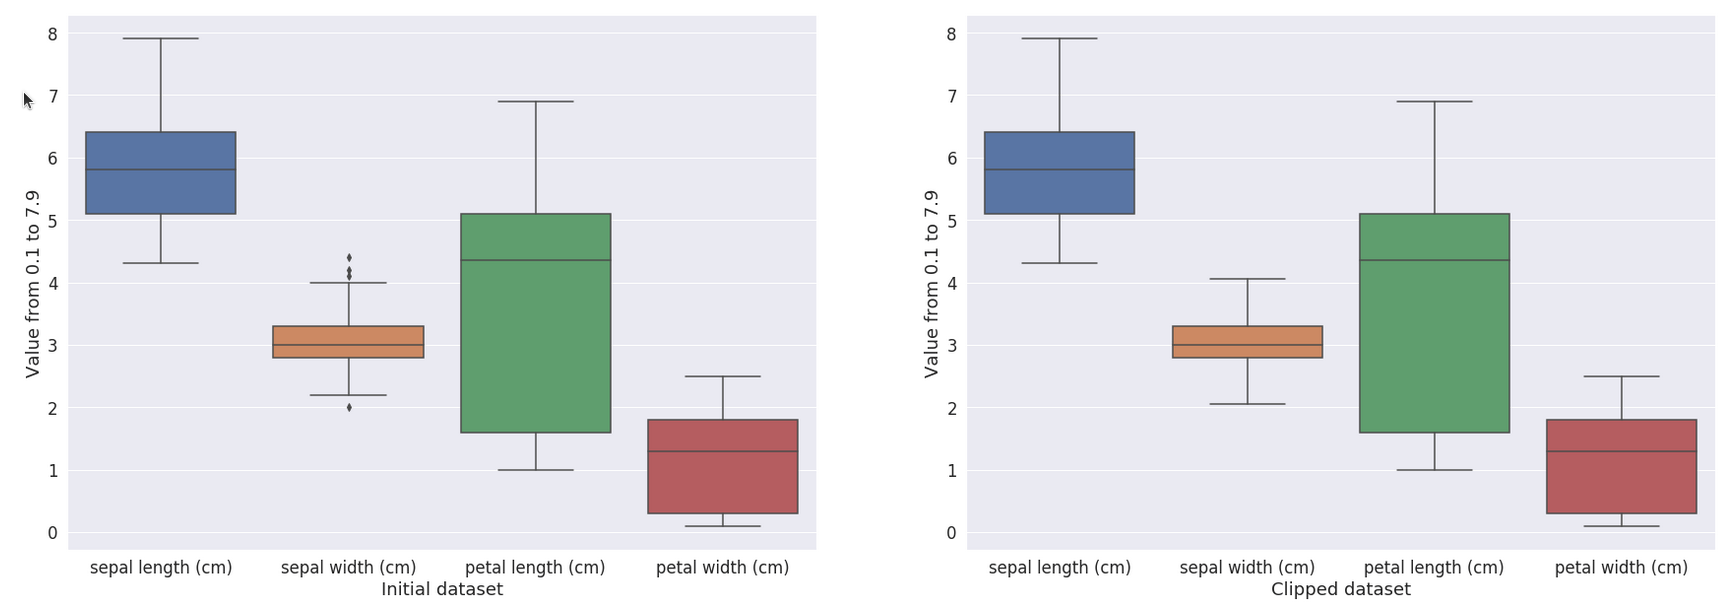
Figure 2: Visualization of the result of the clipping method.#
Generalization#
Code 1 clips values for the iris dataset. To distribute this code, let’s transform it into a code recipe. The input is the Iris dataset, and the
output will be a dataset (named iris_clipped). Code 2
shows the code recipe from this generalization.
# -*- coding: utf-8 -*-
import dataiku
from dataiku import pandasutils as pdu
import pandas as pd
import numpy as np

def clip_value(dataset, column_name):
    """
    Clip values from a dataframe.

    :param dataset: dataframe to process
    :param columns_name: column where values are clipped

    :return: a "clipped" dataset.
    """
    Q1 = dataset[column_name].quantile(0.25)
    Q3 = dataset[column_name].quantile(0.75)
    IQR = 1.5 * (Q3 - Q1)
    lower = Q1 - IQR
    upper = Q3 + IQR
    dataset[column_name] = dataset[column_name].clip(lower=lower, upper=upper)
    return dataset


# Read recipe inputs
iris = dataiku.Dataset("iris")
iris_df = iris.get_dataframe()
column_name = "sepal.width"

iris_clipped_df = clip_value(iris_df, column_name)

# Write recipe outputs
iris_clipped = dataiku.Dataset("iris_clipped")
iris_clipped.write_with_schema(iris_clipped_df)
This code recipe is a way to distribute the code to other people or to apply it to another dataset. Still, the code recipe only partially covers our needs: each time a user wants to leverage it, they have to manually adapt the code to their specific needs. It is not a complicated task, but not the best pattern in terms of usability. Instead, we will create a custom plugin recipe.
Create a custom plugin recipe#
A custom plugin recipe should be created using the “Convert to plugin” button in the action panel. To be able to do that:
Edit the Code recipe
Click the Actions button
Click the Convert to plugin button
Select either New plugin or Existing dev plugin
Choose the appropriate Plugin id
Choose a correct id for the New plugin recipe id
Click Convert
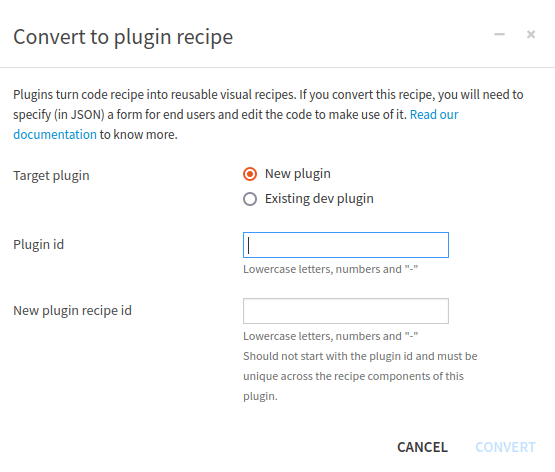
Figure 3: Convert a code recipe to a plugin recipe#
Once this is done, Dataiku generates the custom recipe files and opens the editor to allow to modify of the newly
created plugin recipe. Fig. 4 shows a directory structure example of
a custom plugin recipe named automatic-clipping. This plugin recipe is embedded into a plugin called
demonstration.
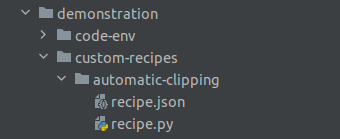
Figure 4: Directory structure of a plugin recipe#
Recipe configuration#
Description and configuration#
The recipe configuration is done in the recipe.json file, which describes the content in more detail in
Component: Recipes.
Analysis and inputs#
The structure of this recipe is simple: its input dataset contains the raw data, its output dataset is the result of the clipping operation.
This coefficient could be adjusted to better adapt the cleaning of the outliers. It should be a parameter of our recipes.
Datasets rarely contain only numbers, and clipping will work only on numbers. So we need a way to select which columns the clipping function will run. This could also be a parameter.
Recipe parameters definition#
The previous analysis leads to the parameter definition shown in Code 4.
"params": [
    {
        "type": "SEPARATOR",
        "description": "<h3>IQR value</h3>"
    },
    {
        "name": "IQR_coeff",
        "type": "DOUBLE",
        "defaultValue": 1.5,
        "label": "IQR coefficient",
        "mandatory": true
    },
    {
        "type": "SEPARATOR",
        "description": "<h3>Column selection</h3>"
    },
    {
        "name": "columns_to_clip",
        "label": "Columns to clip",
        "type": "COLUMNS",
        "columnRole": "dataset_name"
    }
],
This parameter definition will produce the user interface shown in Fig. 5.
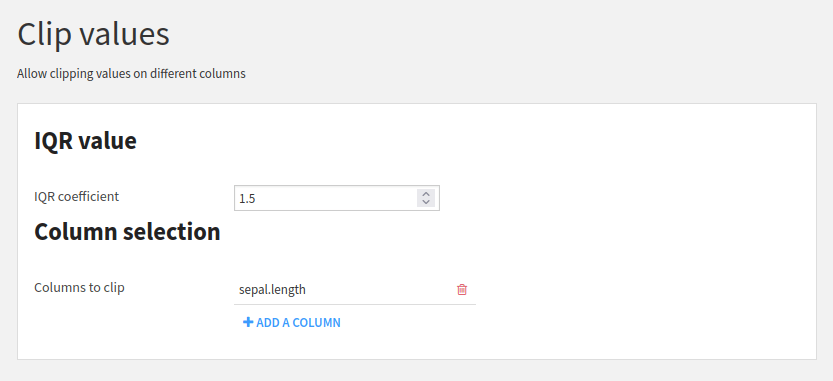
Figure 5: User interface for the parameter entry#
Input and output Datasets#
Input and output Datasets are not handled by the parameter definition but by the inputRoles and outputRoles of
the recipe definition, as shown in Code 5.
"selectableFromDataset": "dataset_name",
"inputRoles": [
    {
        "name": "dataset_name",
        "label": "Datasets to clip",
        "description": "Automatically remove outliers from a dataset, by clipping the values",
        "arity": "UNARY",
        "required": true,
        "acceptsDataset": true
    }
],
"outputRoles": [
    {
        "name": "dataset_clipped",
        "label": "Clipped dataset",
        "description": "Result of the clipping",
        "arity": "UNARY",
        "required": true,
        "acceptsDataset": true
    }
],
The full recipe.json is shown in Code 6. When saving, Dataiku may warn
that the parameter null has no label. This is expected, as we do not define a name or a label for the
SEPARATOR parameter type.
recipe.json#{
"meta": {
"label": "Clip values",
"description": "Allow clipping values on different columns",
"icon": "icon-align-justify",
"iconColor": "orange"
},
"kind": "PYTHON",
"inputRoles": [
{
"name": "dataset_name",
"label": "Datasets to clip",
"description": "Automatically remove outliers from a dataset, by clipping the values",
"arity": "UNARY",
"required": true,
"acceptsDataset": true
}
],
"outputRoles": [
{
"name": "dataset_clipped",
"label": "Clipped dataset",
"description": "Result of the clipping",
"arity": "UNARY",
"required": true,
"acceptsDataset": true
}
],
"params": [
{
"type": "SEPARATOR",
"description": "<h3>IQR value</h3>"
},
{
"name": "IQR_coeff",
"type": "DOUBLE",
"defaultValue": 1.5,
"label": "IQR coefficient",
"mandatory": true
},
{
"type": "SEPARATOR",
"description": "<h3>Column selection</h3>"
},
{
"name": "columns_to_clip",
"label": "Columns to clip",
"type": "COLUMNS",
"columnRole": "dataset_name"
}
],
"selectableFromDataset": "dataset_name",
"resourceKeys": []
}
Coding the Recipe#
Once the recipe is properly defined, we can now dive into the code. First, we should load the data provided by the user, as shown in Code 7.
import dataiku
from dataiku.customrecipe import *
from dataiku import Dataset

from pandas import DataFrame, Series

def load_config():
    """
    Retrieve all parameters entered by the user

    :return: dataset input name,
             dataset output name,
             IQR coefficient,
             columns to clip
    """
    # To retrieve the datasets of an input role named 'input_A' as an array of dataset names:
    input_name = dataiku.customrecipe.get_input_names_for_role('dataset_name')[0]

    # For output, the process is the same:
    output_name = dataiku.customrecipe.get_output_names_for_role('dataset_clipped')[0]

    # IQR value
    IQR_value = dataiku.customrecipe.get_recipe_config().get('IQR_coeff', 1.5)

    # columns_to_clip
    columns_to_clip = dataiku.customrecipe.get_recipe_config().get('columns_to_clip', [])

    return input_name, output_name, IQR_value, columns_to_clip
Then we need to do the clipping (Code 9) and finish by running the whole process: loading, clipping, and saving (Code 10).
def clip_values(input_dataframe, columns_to_clip, IQR_value):
    """
    Clip values from a dataset.

    :param input_dataframe: dataframe to process
    :param columns_to_clip: column where values are clipped
    :param IQR_value: coefficient for clipping

    :return: a "clipped" dataset.
    """
    Q1 = input_dataframe[columns_to_clip].quantile(0.25)
    Q3 = input_dataframe[columns_to_clip].quantile(0.75)
    IQR = IQR_value * (Q3 - Q1)
    lower = Q1 - IQR
    upper = Q3 + IQR
    input_dataframe[columns_to_clip] = input_dataframe[columns_to_clip].clip(lower=lower, upper=upper, axis=1)
    return input_dataframe
def process():
    """
    Do the global processing.
    Load data, process them, clip dataset and save the dataset.
    """
    input_name, output_name, IQR_value, columns_to_clip = load_config()
    input_dataset = dataiku.Dataset(input_name)
    df = input_dataset.get_dataframe()
    clipped_dataset = clip_values(df, columns_to_clip, IQR_value)
    output = dataiku.Dataset(output_name)
    output.write_with_schema(clipped_dataset)


if __name__ == "__main__":
    process()
By turning the code recipe into a custom recipe plugin, we now have a generic recipe that can be applied to any
dataset. For example, if we load the california_housing dataset from scikit learn
(datasets.fetch_california_housing()), drop the columns: Population, Latitude, and Longitude, the
boxplot looks like Fig. 6.
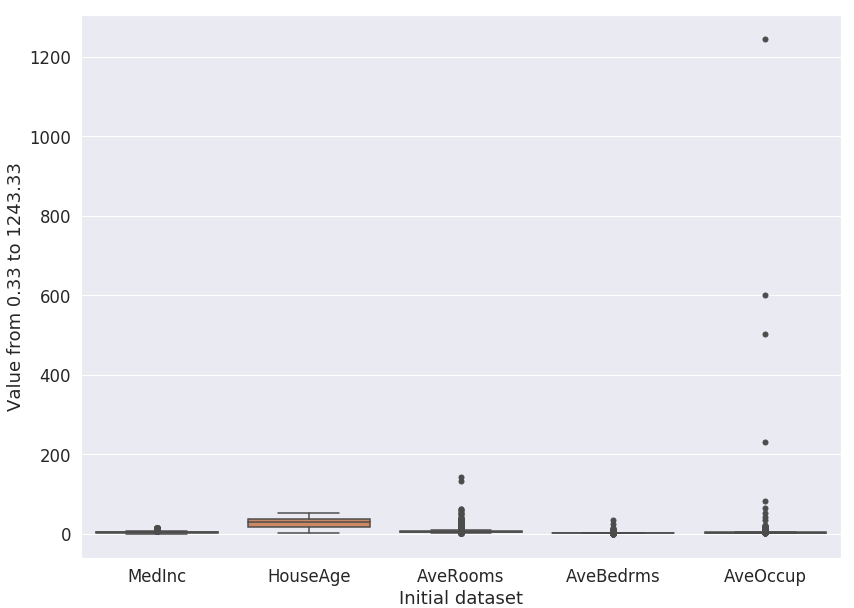
Figure 6: Boxplot for the California housing dataset.#
Fig. 7 shows the parameters used to clip
the dataset, clipping only AveOccup and AveRooms columns.
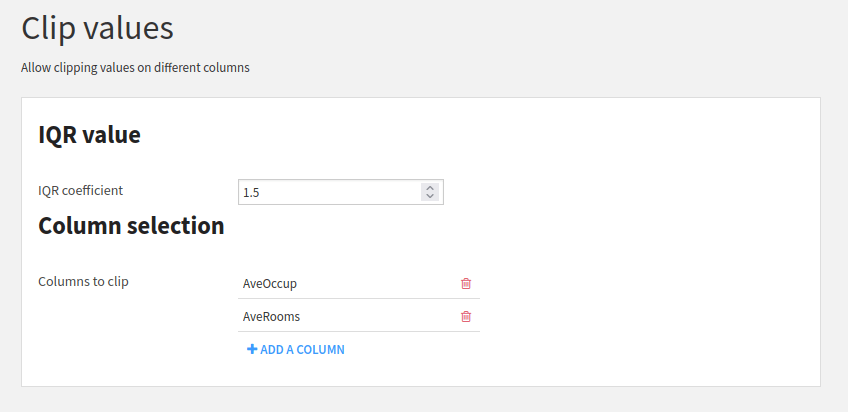
Figure 7: Parameter for clipping the California housing dataset.#
And the resulting dataset looks like in Fig. 8.
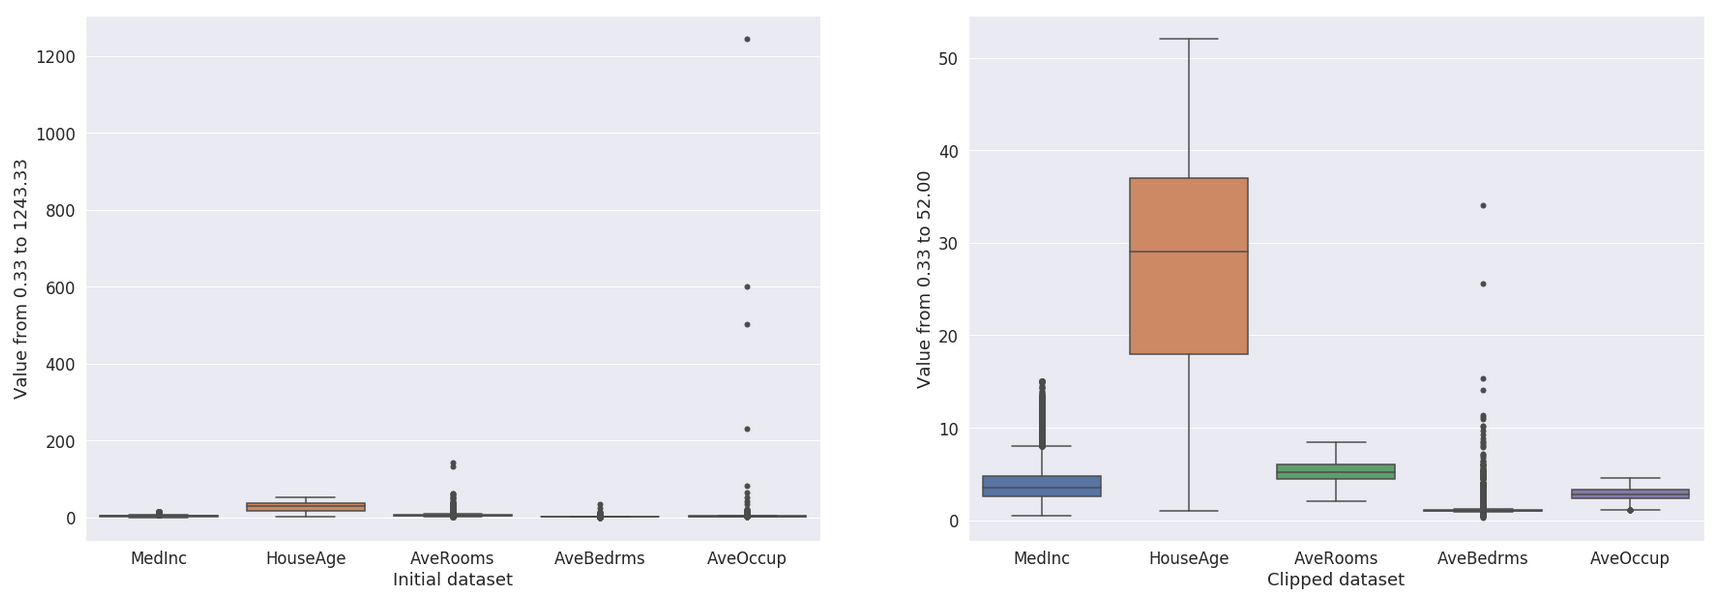
Figure 8: Result of the clipping.#
Conclusion#
In this tutorial, we built a simple custom recipe plugin component that allows non-coder users to clip a dataset. Of course, the processing steps presented here are simple. Still, the true goal of this tutorial is to bootstrap your work as a plugin developer to transform your code into an operational custom visual recipe.
From there, you can look into more elaborate aspects, like:
making your code more robust with exception handling and logging
adding more input parameters to make the outlier detection more flexible
adding a parameter to allow clipping, removing, or keeping the outliers