

Bokeh: Your first webapp#
Prerequisites#
Dataiku >= 11.0 (You can also use Dataiku cloud)
Some familiarity with python
Bokeh is a Python library for creating interactive visualizations for modern web browsers. This tutorial will create a simple Bokeh webapp in Dataiku. We will use sample sales data from the fictional Haiku T-shirt company, similar to the data used in the Basics tutorials. The webapp will display the total amount sold for each selected country. Each time the user changes the input, the plot is updated.
Note
We have tested this tutorial using a Python 3.9 code environment with bokeh==2.4.3. Other Python
versions may be compatible, Bokeh version before 2.4.0 may be incompatible. Check the webapp logs for potential
incompatibilities.
Data preparation#
Start by downloading the source data following
this link
and make it available in your Dataiku project, for example, by uploading the .csv file. Name the resulting
Dataiku dataset Orders_by_Country_sorted.
Creating the webapp#
First, you need to create a Bokeh webapp. You will use the empty Bokeh template and generate a Bokeh webapp named:
Your first webapp, as shown in Fig. 1 and
2.
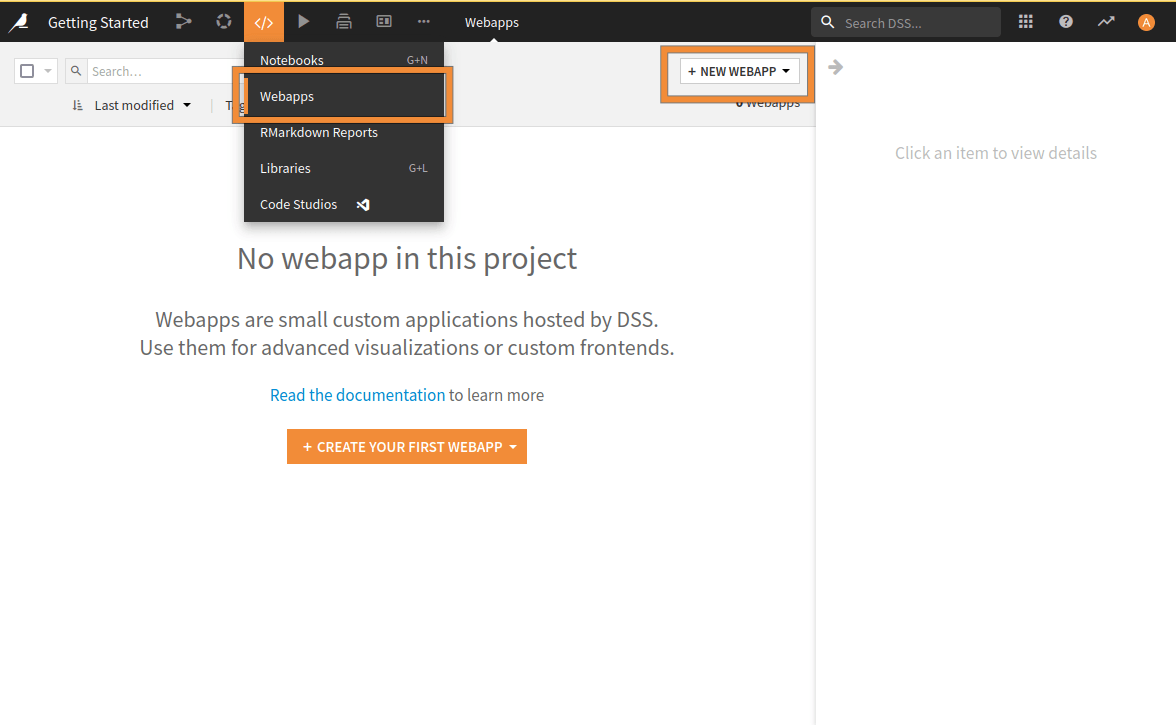
Fig. 1: Creation of a webapp.#
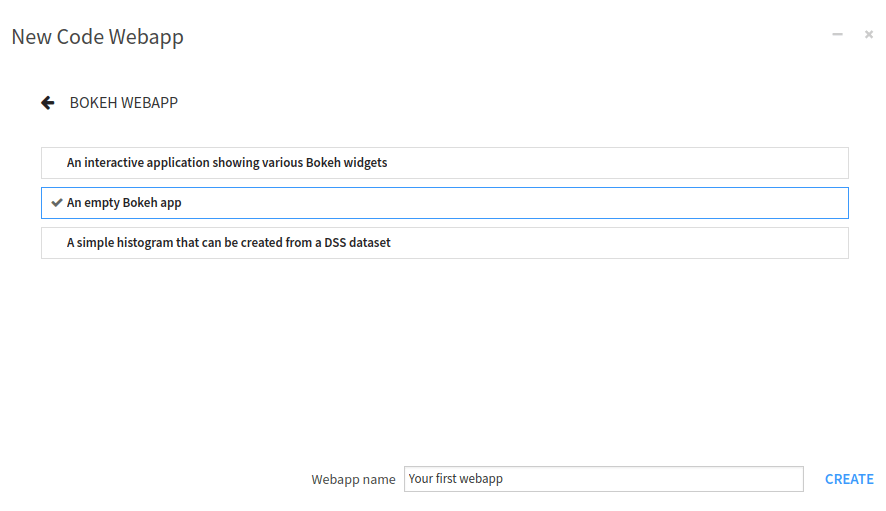
Fig. 2: Naming the newly created webapp.#
Once the webapp is created, you will land on an empty webapp. To be able to edit code, you have to select the “Settings” tab. This window comprises two parts. Usually, the left part is where we enter the code, and the right part is dedicated to the preview of the webapp, as shown in Fig. 3.
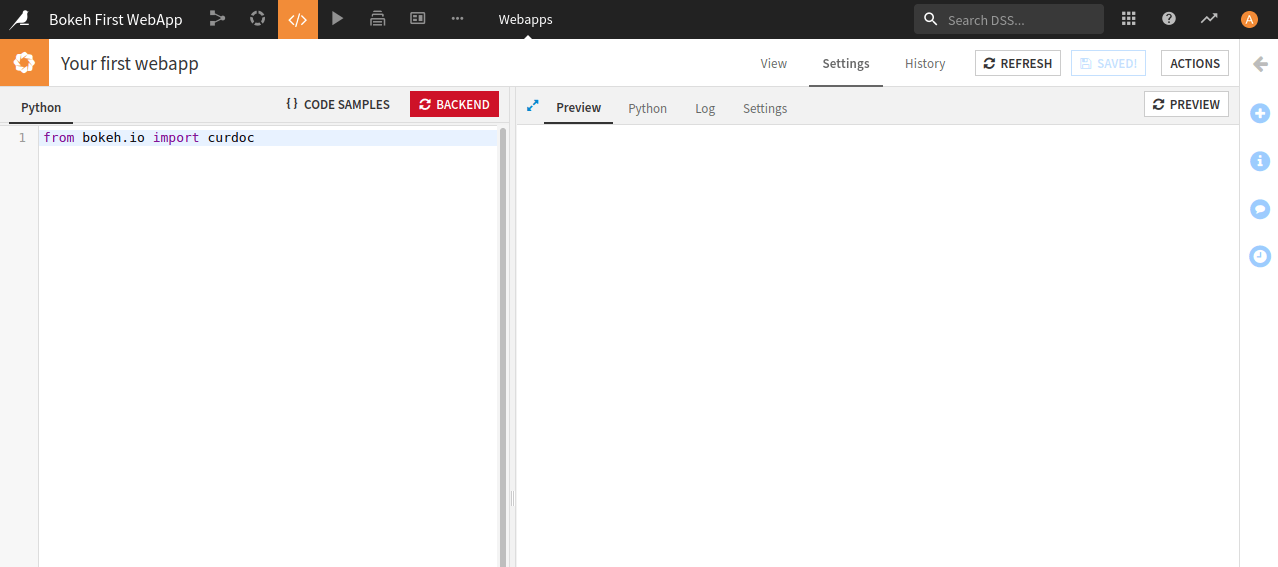
Fig. 3: Edition of the Bokeh webapp.#
On the right side, there are four tabs, allowing you to switch to:
Preview mode: default opened tab.
Python editor: to have two different views of your code.
Log: helpful in debugging when something goes wrong. If you do not see your logs, click on the “Refresh log” button to update the log window.
Settings: to configure the webapp, like the code environment used for the webapp.
Sketching the webapp#
The webapp will consist of a title, a text (to explain the purpose of the webapp), a multi-select object (for selecting the countries), and a plot. This tutorial will also focus on good practices, like single responsibility, forbidding the usage of global variables, and so on.
Import package and set up the application#
First, you will need some data, so you have to use the dataiku package. All along this tutorial, you will need some
other packages/components, and you will include them all at once. After importing the libraries, you will create a
function to render the application’s title. You will also make a description of the application. And finally, you will
define a function for the application creation and call it to render the webapp, as shown in
Code 1. The emphasized line is the place to write code for reading data. You will do it just
after.
import dataiku
from bokeh.io import curdoc
from bokeh.models import Div, MultiSelect, ColumnDataSource, FactorRange
from bokeh.plotting import figure
from functools import partial
from bokeh.layouts import layout


def add_title():
    """
    Create the title for the application.
    :return: The title object.
    """
    title = Div(text="""<h1>Total Sales by Country</h1>""",
                style={'backgroundColor': '#5473FF',
                       'color': '#FFFFFF',
                       'width': '98vw',
                       'margin': 'auto',
                       'textAlign': 'center'})
    return title


def add_text():
    """
    Create a description of the application.
    :return: The text object.
    """
    text = Div(text="This graph allows you to compare the total sales amount and campaign influence by country.",
               sizing_mode="stretch_width",
               align="center")
    return text


def application():
    """
    Create the application.
    """

    title = add_title()
    text = add_text()

    app = layout([title, text])
    curdoc().add_root(app)


application()
Providing data#
To use the dataset, you must read Orders_by_Country_sorted with the dataiku package,
as shown in Code 2. Reading the dataset will slightly modify the function
application() (Code 2 replaces the emphasized line in
Code 1).
# READ DATASET
dataset = dataiku.Dataset("Orders_by_Country_sorted")
df = dataset.get_dataframe()
# Only keep data where the campaign has been launched
df = df[df['campaign']]

source = ColumnDataSource(dict(x=[], y=[]))
Plotting the data#
Once the data is read, you will create a Plot. You could plot the data directly, but you will face problems when you want to update the plot (Bokeh won’t let you quickly update it). So you will first create a plot with empty data, and later on, you will update this plot with the selected country. Code 3 shows how to create an empty plot, ready to be updated when needed. The highlighted lines show the tweaks you have to do to plot data dynamically.
def add_plot(df, source):
    """
    Create a plot for rendering the selection
    :param df: The dataframe to use.
    :param source: The columnSource to use.
    :return: The plot object.
    """
    plot = figure(plot_width=600, plot_height=300,
                  x_axis_label='Country',
                  y_axis_label='Total Amount',
                  title='Total amount per campaign',
                  x_range=FactorRange(factors=list(df.country)),
                  sizing_mode='stretch_width'
                  )
    plot.left[0].formatter.use_scientific = False
    plot.xaxis.major_label_orientation = "vertical"
    plot.vbar(source=source, x='x', top='y', bottom=0, width=0.3)

    return plot
Of course, you will have to modify your application function to reflect the changes, as shown in Code 4 (highlighted lines).
def application():
    """
    Create the application.
    """
    # READ DATASET
    dataset = dataiku.Dataset("Orders_by_Country_sorted")
    df = dataset.get_dataframe()
    # Only keep data where the campaign has been launched
    df = df[df['campaign']]

    source = ColumnDataSource(dict(x=[], y=[]))

    title = add_title()
    text = add_text()
    plot = add_plot(df, source)

    app = layout([title, text, plot])
    curdoc().add_root(app)
User selection and updating the plot#
In the same way, you have created the plot, and you will create a function for the multi-select object (
Code 5). The highlighted line allows Bokeh to run a function (update_fig) when the
user changes the object’s value. Usually, the library imposes the prototype of this function. But as you need
some additional data to be passed to this function, you will use the partial function to provide other data to
the update_fig function. Code 6 shows the implementation of the function.
def add_select(df, source, plot):
    """
    Create a Multi-select for the country selection.
    :param df: The dataframe to use.
    :param source: The columnSource to use.
    :param plot: The plot to update.
    :return: The multi-select object.
    """
    select = MultiSelect(title="Select countries:",
                         options=[i for i in sorted(df.country.unique())],
                         value=['United States', 'China', 'Japan', 'Germany', 'France', 'United Kingdom'],
                         size=10,
                         sizing_mode='stretch_width'
                         )
    select.on_change("value", partial(update_fig, df=df, source=source, plot=plot))
    return select
def update_fig(_attr, _old, new, df, source, plot):
    """
    Callback for updating the plot with the new values.
    :param _attr: Unused: the attribute that is changed.
    :param _old: Unused: the old value.
    :param new: The new value.
    :param df: The dataframe to use.
    :param source: The columnSource to use.
    :param plot: The plot to update.
    """

    data = df[df['country'].isin(new)]
    source.data = dict(
        x=data.country,
        y=data.total_amount
    )
    plot.x_range.factors = list(source.data['x'])
And, of course, you will need to update the application to reflect these changes. As you plot an empty figure, you should update it with some default values (provided in the multi-select object), so the highlighted lines in Code 7 show how to do this.
def application():
    """
    Create the application.
    """
    # READ DATASET
    dataset = dataiku.Dataset("Orders_by_Country_sorted")
    df = dataset.get_dataframe()
    # Only keep data where the campaign has been launched
    df = df[df['campaign']]

    source = ColumnDataSource(dict(x=[], y=[]))

    title = add_title()
    text = add_text()
    plot = add_plot(df, source)
    select = add_select(df, source, plot)

    update_fig("", "", select.value, df, source, plot)

    app = layout([title, text, select, plot])
    curdoc().add_root(app)
Going further#
If everything goes well, you should go to a webapp that looks like Fig. 4.
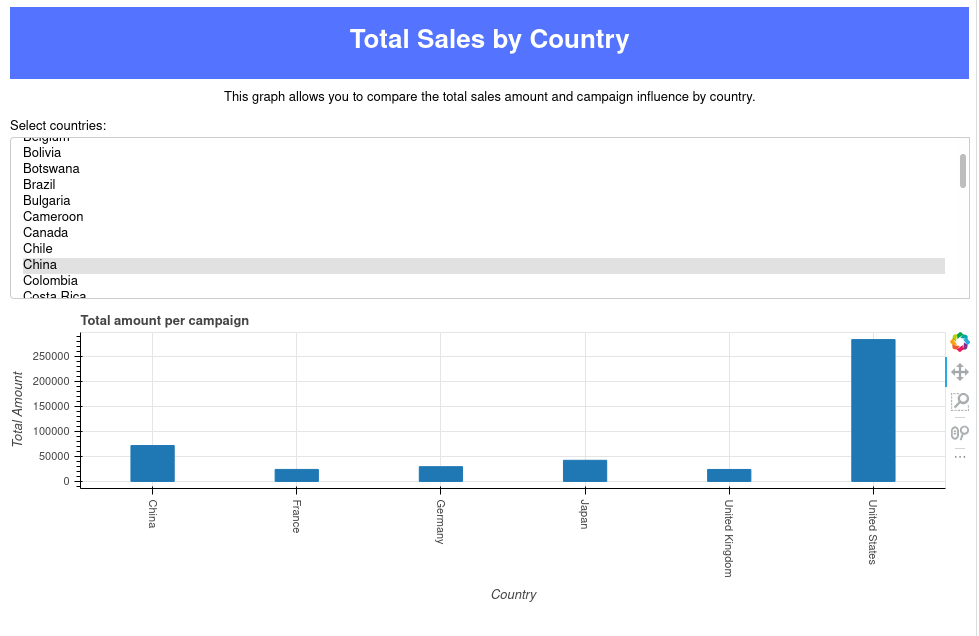
Fig. 4: Final state of the webapp.#
You learned how to read and use a dataset with Dataiku and Bokeh. You also know how to plot a histogram based on this dataset. Using the same principles, you can draw another chart, explore other datasets, add interactivity, etc.
Here is the complete code of the web application:
app.py
import dataiku
from bokeh.io import curdoc
from bokeh.models import Div, MultiSelect, ColumnDataSource, FactorRange
from bokeh.plotting import figure
from functools import partial
from bokeh.layouts import layout


def add_title():
    """
    Create the title for the application.
    :return: The title object.
    """
    title = Div(text="""<h1>Total Sales by Country</h1>""",
                style={'backgroundColor': '#5473FF',
                       'color': '#FFFFFF',
                       'width': '98vw',
                       'margin': 'auto',
                       'textAlign': 'center'})
    return title


def add_text():
    """
    Create a description of the application.
    :return: The text object.
    """
    text = Div(text="This graph allows you to compare the total sales amount and campaign influence by country.",
               sizing_mode="stretch_width",
               align="center")
    return text


def update_fig(_attr, _old, new, df, source, plot):
    """
    Callback for updating the plot with the new values.
    :param _attr: Unused: the attribute that is changed.
    :param _old: Unused: the old value.
    :param new: The new value.
    :param df: The dataframe to use.
    :param source: The columnSource to use.
    :param plot: The plot to update.
    """

    data = df[df['country'].isin(new)]
    source.data = dict(
        x=data.country,
        y=data.total_amount
    )
    plot.x_range.factors = list(source.data['x'])


def add_select(df, source, plot):
    """
    Create a Multi-select for the country selection.
    :param df: The dataframe to use.
    :param source: The columnSource to use.
    :param plot: The plot to update.
    :return: The multi-select object.
    """
    select = MultiSelect(title="Select countries:",
                         options=[i for i in sorted(df.country.unique())],
                         value=['United States', 'China', 'Japan', 'Germany', 'France', 'United Kingdom'],
                         size=10,
                         sizing_mode='stretch_width'
                         )
    select.on_change("value", partial(update_fig, df=df, source=source, plot=plot))
    return select


def application():
    """
    Create the application.
    """
    # READ DATASET
    dataset = dataiku.Dataset("Orders_by_Country_sorted")
    df = dataset.get_dataframe()
    # Only keep data where the campaign has been launched
    df = df[df['campaign']]

    source = ColumnDataSource(dict(x=[], y=[]))

    title = add_title()
    text = add_text()
    plot = add_plot(df, source)
    select = add_select(df, source, plot)

    update_fig("", "", select.value, df, source, plot)

    app = layout([title, text, select, plot])
    curdoc().add_root(app)


def add_plot(df, source):
    """
    Create a plot for rendering the selection
    :param df: The dataframe to use.
    :param source: The columnSource to use.
    :return: The plot object.
    """
    plot = figure(plot_width=600, plot_height=300,
                  x_axis_label='Country',
                  y_axis_label='Total Amount',
                  title='Total amount per campaign',
                  x_range=FactorRange(factors=list(df.country)),
                  sizing_mode='stretch_width'
                  )
    plot.left[0].formatter.use_scientific = False
    plot.xaxis.major_label_orientation = "vertical"
    plot.vbar(source=source, x='x', top='y', bottom=0, width=0.3)

    return plot


application()