

Using LIME for Model Explainability#
Introduction#
As machine learning models like deep neural networks and ensemble methods increase in complexity, understanding why a model makes certain predictions is crucial. As these models often operate as black boxes, it becomes challenging to trust their outputs, especially in critical fields like healthcare, finance, and legal systems. This is where model explainability comes into play, and LIME (Local Interpretable Model-agnostic Explanations) is one of the most powerful tools in this domain.
LIME provides an intuitive human-readable explanation for individual predictions and for a model as a whole. Unlike traditional evaluation metrics, which provide a general sense of model performance, LIME focuses on explaining specific outputs, making it particularly valuable for identifying biases, debugging models, or building trust with stakeholders.
LIME can be applied to binary, multi-class classification, and regression models. It can take numerical, categorical, text, and image inputs. For the scope of this tutorial, we will focus on a binary classification model that predicts numerical and categorical features.
Let’s dive in!
Prerequisites#
Dataiku >= 12.0
Python >=3.9
A code environment:
with the
Dataiku Visual Machine Learning Packagespackage set installedwith the following packages:
lime
matplotlib
Expected initial state:
Know the basic concepts of LIME. See blog post
Have a trained Binary Classification Saved Model deployed to the Flow in a Dataiku Project.
Warning
For compatibility reasons, it is recommended that you use the same code environment (version and packages) for this tutorial as the one used for the Model training.
Step 0: Import requires packages#
# -*- coding: utf-8 -*-
import dataiku
import pandas as pd, numpy as np

import warnings
import logging
import sklearn
import copy

import lime
from lime import lime_tabular
from lime import submodular_pick
Step 1: Load the Active SMV#
## Replace SAVE_MODEL_ID and TRAIN_DATASET_NAME with valid identifiers taken from your project

model = dataiku.Model("SAVED_MODEL_ID")
pred = model.get_predictor()
input_df = dataiku.Dataset("TRAIN_DATASET_NAME").get_dataframe()
Step 2: Prepare an interpretable representation of the data for the LIME Explainer#
We first need to fetch the feature handling used in the Active Saved Model Version and extract:
All the selected features
The target
The categorical features
The numerical features
features = []
target = None
cat_features = []
num_features = []
feature_prep = pred.params.preprocessing_params.get("per_feature",{})
for k, v in feature_prep.items():
    if v["role"] == "INPUT":
        features.append(k)
        if v["type"] == "CATEGORY":
            cat_features.append(k)
        elif v["type"] == "NUMERIC":
            num_features.append(k)
        else:
            logging.warning(f"type {v['type']} is not supported")
    elif v["role"] == "TARGET":
        target = k
    elif v["role"] == "REJECT":
        pass
    else:
        logging.warning(f"role {v['role']} is not supported")
We can then use the activated features to build and store the training features in a numpy 2D Array.
training_df = input_df[features]
data = training_df.to_numpy()
The LIME explainer requires all input features to be numerical. We, therefore, need to transform all of the input categorical features to feed them as input to the LIME explainer.
categorical_features = [i for i,feature in enumerate(features) if feature in cat_features]

categorical_names = {}
for feature in categorical_features:
    le = sklearn.preprocessing.LabelEncoder()
    le.fit(data[:, feature])
    data[:, feature] = le.transform(data[:, feature])
    categorical_names[feature] = le.classes_
The last step to make our data LIME Explainer compliant is to cast our feature arrays as all floats.
data = data.astype(float)
Step 3: Build LIME Explainer#
For this example, we will use the LimeTabularExplainer explainer, but for other use cases,
the LimeTextExplainer or LimeImageExplainer could be more relevant.
explainer = lime_tabular.LimeTabularExplainer(mode = "classification",
                                            training_data = data,
                                            feature_names = features,
                                            class_names = pred.get_classes(),
                                            categorical_features= categorical_features,
                                            categorical_names = categorical_names,
                                            discretize_continuous = False, # To resolve ValueError: Domain error in arguments.
                                            kernel_width=3,
                                            verbose = True)
The lime explainer is now ready! We have one last step before running lime explanations on our test instances. We need to define a predict function that can take a list of instances in their interpretable representation and run them through our Dataiku Saved Model to get a list of predictions.
def dku_pred_fn(records):
    decoded_records = []
    for x in records: # decode records
        decoded_record = [categorical_names[i][int(x[i])] if i in categorical_features else value for i, value in enumerate(x)]
        decoded_records.append(decoded_record)
    x_pred = pred.predict(pd.DataFrame(data = decoded_records, columns = features))
    return x_pred.to_numpy()[:,1:].astype(float)
Step 4: Run LIME Explainer on a Single Instance#
To run the Explainer on a single Instance, we need to feed it in its human interpretable format and encode all categorical features when applicable.
For simplicity, here, we will reuse rows from the previously prepared data.
np.random.seed(1)
i = 50
exp = explainer.explain_instance(data_row = data[i],
                                predict_fn = dku_pred_fn,
                                num_features=5)
exp.show_in_notebook(show_all=False)
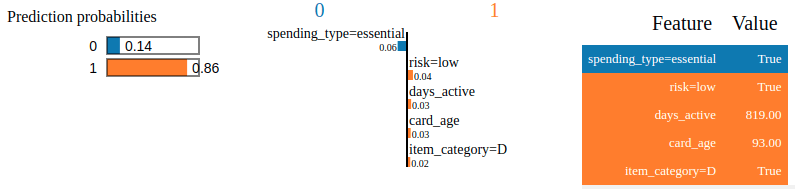
Figure 1: Result of LIME Explainer on a Single Instance.#
We just computed our first explanation as shown in Figure 1! It is time to generate visualizations and publish them in a Dashboard to share them with the relevant stakeholders. To do so, we will leverage static insights, resulting in a plot similar to Figure 2.
from dataiku import insights
# Option 1
insights.save_data("LIME_single_instance_exp_html",payload = exp.as_html(), content_type = "text/html")

# Option 2
fig = exp.as_pyplot_figure()
insights.save_figure("LIME_single_instance_exp_plotly")
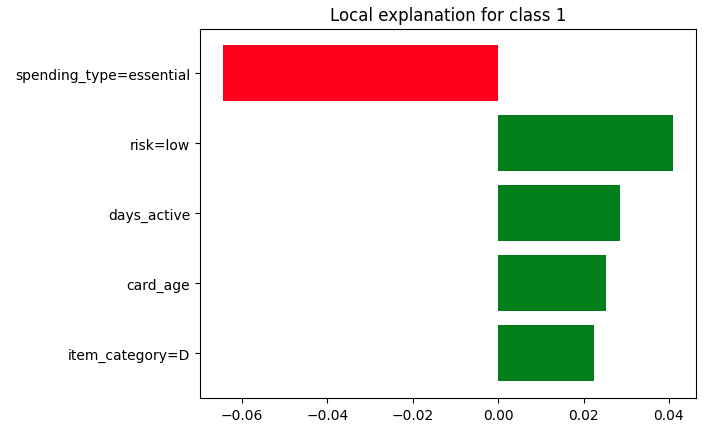
Figure 2: Insight of the explanation.#
Step 5: Run SP-LIME Explainer for a global representation of the model.#
We can go one step further and run SP-LIME. SP-LIME with return num_exps_desired explanations on a sample set to provide a non-redundant global decision boundary of the original model.
The resulting explanations can be viewed in the same way as the individual explanation visualizations.
sp_obj = submodular_pick.SubmodularPick(explainer = explainer,
                                        data = data,
                                        predict_fn = dku_pred_fn,
                                        num_features=5,
                                        num_exps_desired=10)
non_redudant_global_exps = sp_obj.sp_explanations
Wrapping up#
In this tutorial, we applied LIME and SP-LIME to a Dataiku Saved Model and published the results on a Dataiku Dashboard. We can now confidently explain the decision mechanisms of any black box model in a human-interpretable way. This allows us to:
Chose between competing models
Detect and improve untrustworthy models
Get insights into the model
As a next step, we could explore the application of LIME to Text, Image-based Classification models, or Tabular Regression models. For more intuition on the inner workings of LIME, we recommend reading this blog or the research paper behind LIME