

Editing & Debugging Code with VS Code
When you’re working in a Dataiku project, debugging a failing recipe directly in the built-in editor can be limiting: no breakpoints, no variable inspection, no familiar IDE shortcuts. Code Studio solves this by letting you open your project’s code in a full VS Code environment, without leaving Dataiku.
In this tutorial, you’ll use VS Code within a Code Studio to edit and debug a failing code recipe and a project library, then sync your changes back to Dataiku. By the end, you’ll know how to move between the Flow and your IDE to fix errors faster than you could from the recipe editor alone.
If you want to know what can be edited in Code Studio and thus within VS Code, see this page.
Caution
VSCode for Code Studio provides a richer editing environment, but doesn’t serve as a full replacement for the Dataiku user interface. Several important operations will still be done visually in your Dataiku. For example, when you execute a code recipe from Code Studio, it doesn’t trigger a Dataiku job in your project.
Prerequisites
A Dataiku 11+ instance.
A Kubernetes cluster is configured. For details, visit Elastic AI Computation.
A base image is built. Typically, this is built using a command such as
./bin/dssadmin build-base-image --type container-exec. For details, see Build the Base Image.
No additional setup is required: Kubernetes and the base image are managed for you.
Regardless of your setup, you’ll also need:
Administrator privileges for your user profile.
A Code Studio template (see this tutorial if you need assistance).
Creating the project and the necessary files
Download the
starter project.From the Dataiku homepage, click +New Project > Import a Project, and select the downloaded zip file.
From the project homepage, select the Code Studios option from the Code menu (</>).
Click the Create your first code studio button, select the template created for this tutorial, and give it a meaningful name, such as
editor. You don’t need to start the Code Studio; Dataiku will launch it when needed.Then go to the Flow, either by selecting the Flow from the Flow menu or by using the G+F shortcut.
Use case summary
You’ll work with a project that contains a simple pipeline: one input dataset, two Python recipes, and two output datasets. Both recipes generate errors when run. Your goal is to debug these recipes in your own IDE, using Code Studios within Dataiku.
See also
There are other ways to debug code recipes with Dataiku. You may also consider using various Coding with Dataiku.
Editing a code recipe within VS Code
In a Dataiku project, you can start a Code Studio instance from a code recipe by clicking the the Edit in Code Studio button on the top right of each code recipe.

A pop-up will then ask you to select the Code Studio instance to use.
After editing your recipe in VSCode, click Sync files with DSS to update the file content on the Dataiku server.
Remember, changes in a Code Studio running in a Kubernetes pod are not saved unless you click Sync files with DSS. For more on Code Studio, see Technical Details in Dataiku’s reference documentation.

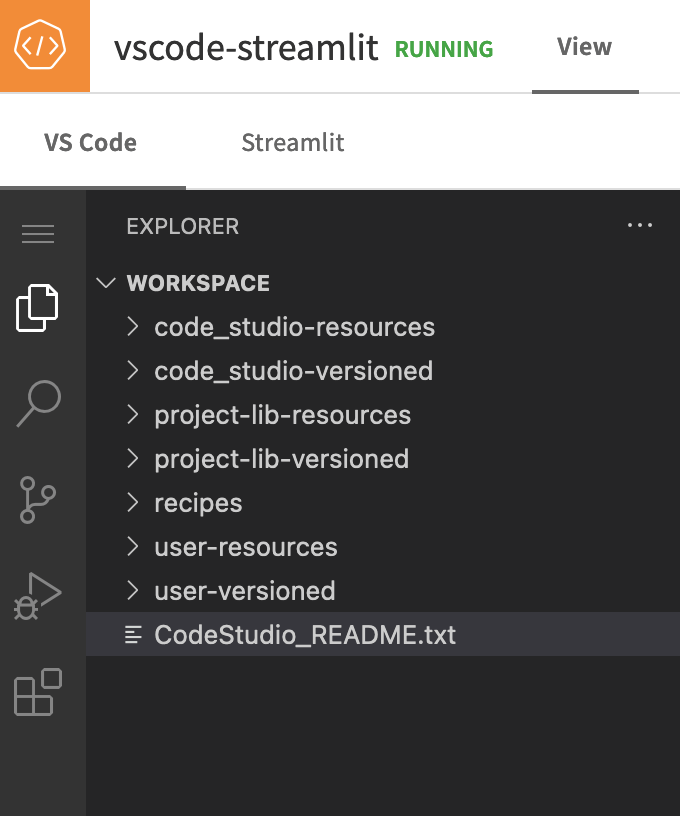
From a Code Studio instance, several directories are available, as you can see in the VSCode file explorer on the left.
Debugging within VS Code
You’ll now inspect and debug the compute_contacts_1 recipe in Code Studio.
From the recipe, select Edit in Code Studio.
Dataiku displays the VS Code Workspace Explorer ready to debug the recipe.
Tip
To go back and forth between the Flow and your Code Studio, you can keep the VS Code Workspace Explorer open in its own browser tab.
You’ll work with the Python recipe, compute_contacts_1. To find it:
Open the Recipes folder (
recipes).Select
compute_contacts_1.py.Run the code to generate the errors you saw when running the recipe, if you have done it.
Note
VSCode might warn you that the Python Interpreter is not set up. Run the command Python: Select Interpreter (via the command palette) and choose a valid Python interpreter.
Running the recipe in VS Code displays the same error you saw in the Flow. This confirms the Code Studio is configured correctly. By looking at the result of this execution, you will see (in the Traceback) that the error comes from line 19.
You can work with the code recipe within your own IDE, all from Dataiku. However, you are now working in VS Code, rather than in the Dataiku Python recipe editor. If you make any changes to the code in the IDE, you’ll need to sync them back to Dataiku. Since the error seems to originate before line 19, set a breakpoint and use the VS Code debugger.
Click in the far left margin before line 19 to set a breakpoint.
Select Debug Python File from the dropdown at the top right, or from menu > Run > Start Debugging.
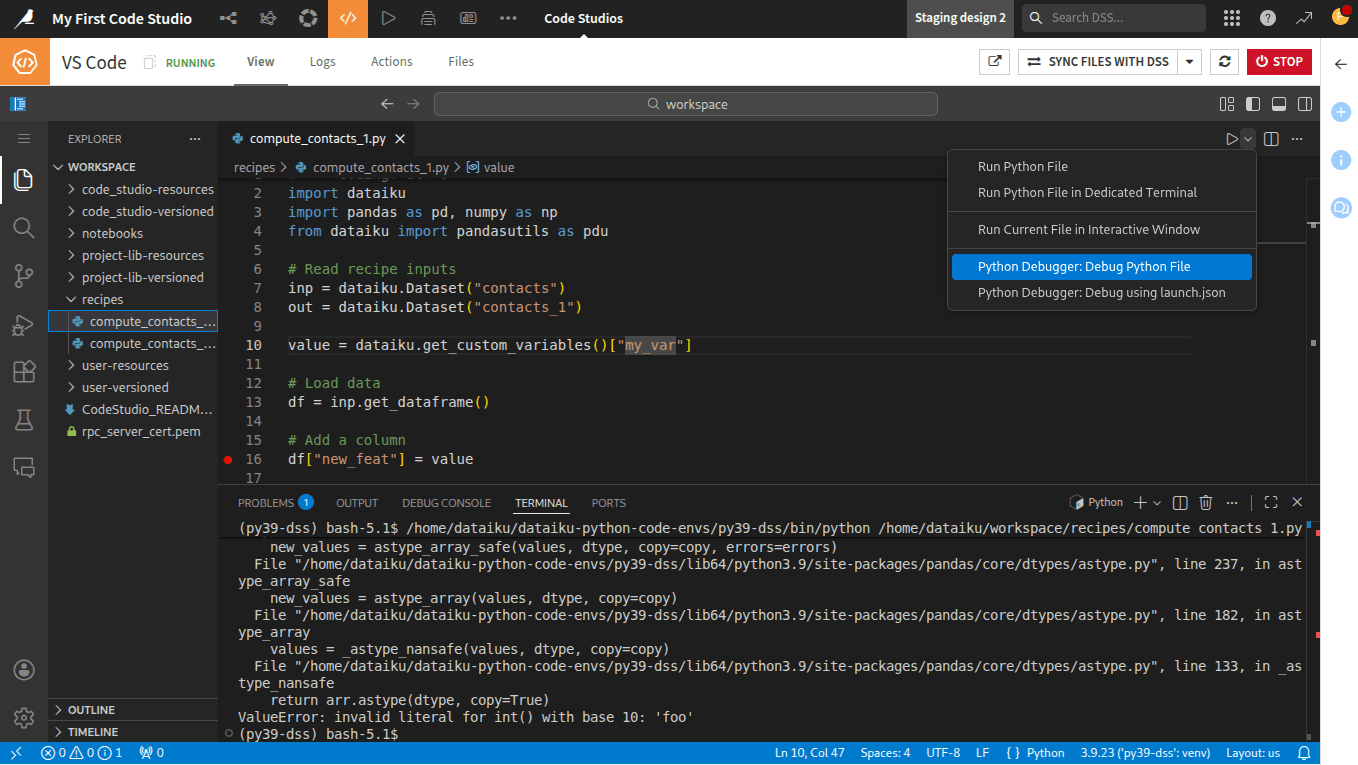
VS Code executes the code and pauses at the breakpoint. To debug the code, you can utilize navigation commands and shortcuts in the IDE. More specifically, you can inspect the variables.
Expand Variables > Locals in the debugger explorer, in the left panel.
Upon inspection, you can see that the variable
valueis fetched from the project variables. If you want to see the definition of the project variables, select … > Variables from the top navigation bar of the project.You can change the value of this variable directly in VS Code, and then click the Continue button to see if it resolves the problem.
Now, you know that the error originates from the definition of the variable:
value.Edit the code, replacing
my_varwithmy_var2on line 16.value = dataiku.get_custom_variables()["my_var2"]
Run the code again.
Now that the code executes without error, you can sync the changes back to the recipe in the Flow.
Syncing the changes back to Dataiku
When working in Code Studios, you edit a local copy of your code separate from the version in Dataiku. After making changes, you must click “Sync files with DSS” in VS Code to update your project in Dataiku. If you return to the Flow without syncing, the changes will not appear in the Flow or in Dataiku’s interface. Always sync before switching back to Dataiku to ensure your edits are saved.
In VS Code, select Sync Files With DSS in the upper right.
Once the sync is complete, VS Code displays a green checkbox.
Return to the Flow.
Open the
compute_contacts_1Python recipe.You can see that the recipe is updated and that
"my_var"is now"my_var2".Run the recipe.
The recipe runs without warnings.
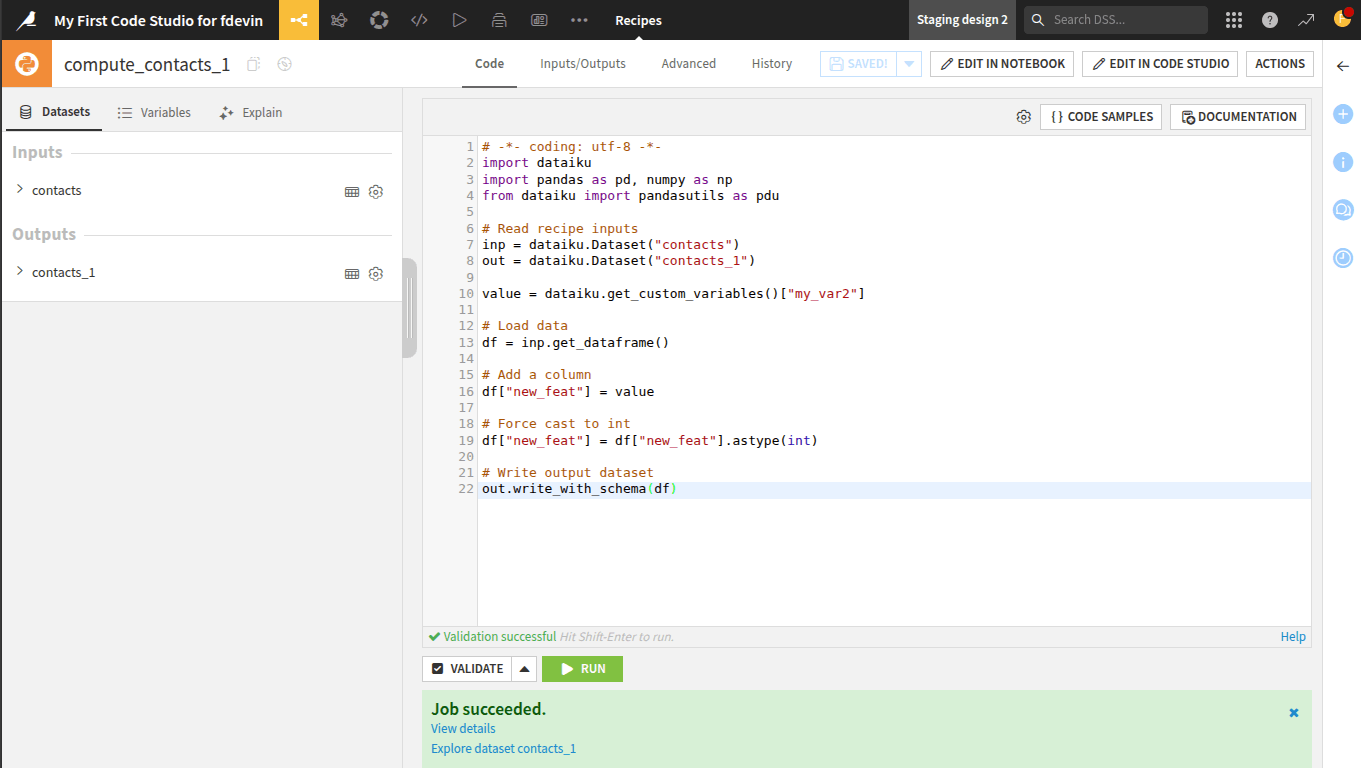
Python recipe successfully edited and synchronized back to Dataiku.
Editing a project library file
Project libraries are a great way to organize your code in a centralized location that you can reused across any project on the instance. From Dataiku, you can also connect to a remote Git repository to manage your code. For more details, visit Reusing Python Code.
In this section, you’ll practice editing a project library in Code Studio. You’ll be working with the second Python recipe in the project.
Running the Python recipe
Return to the Flow.
Run the Python recipe that
generates contacts_2.
This recipe is performing a simple transformation using a custom Python package, my_package.
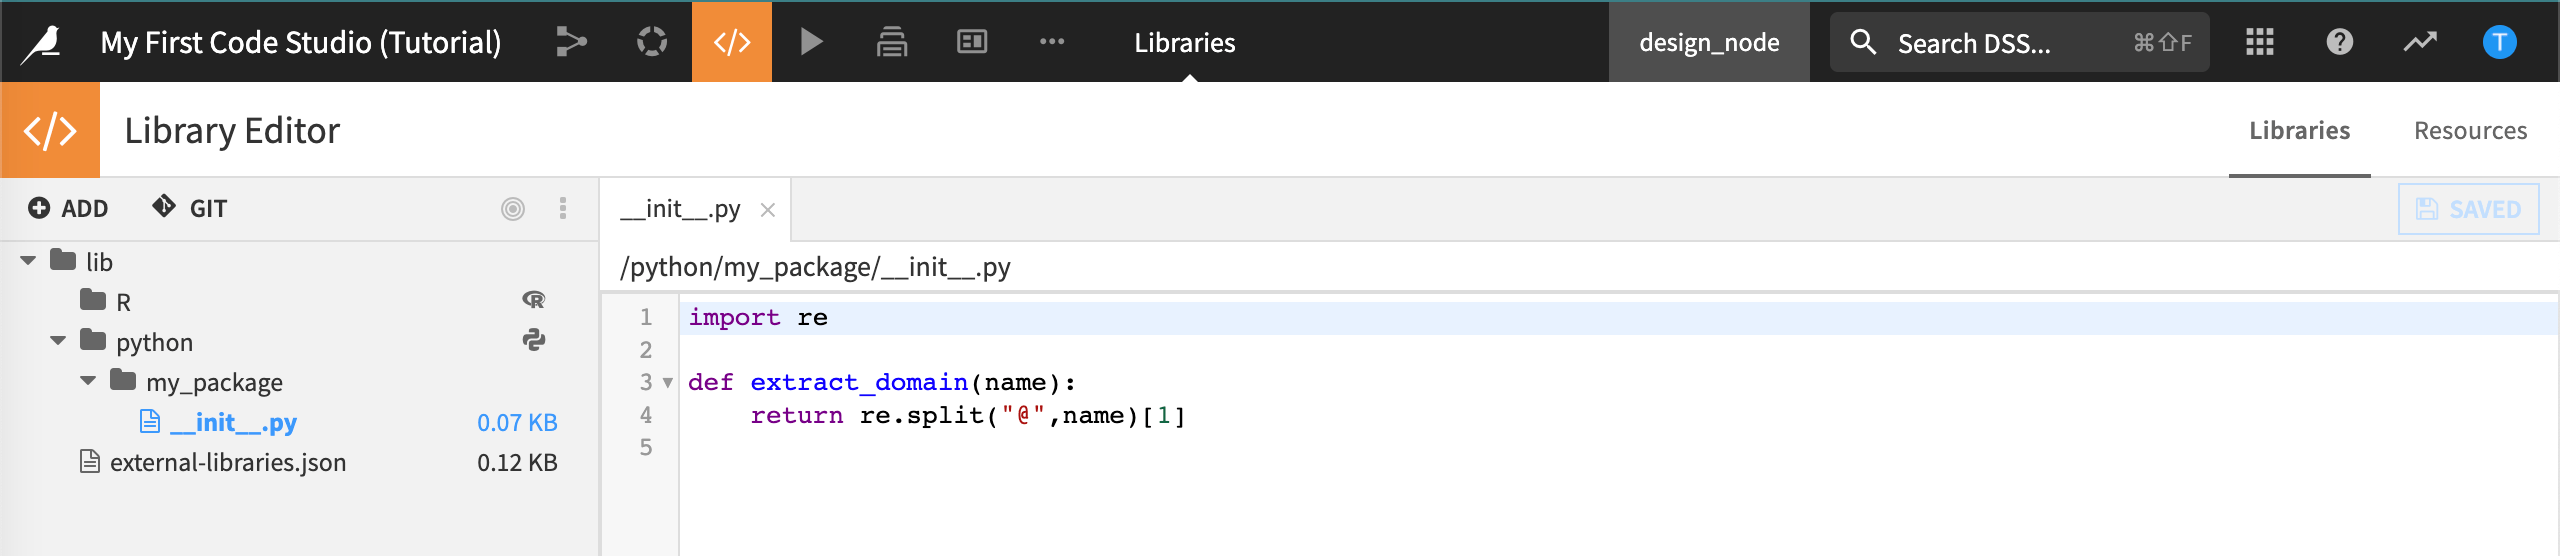
Custom Python package in the project library.
The error list index out of range is raised at line 21 of the code.
row['new_feat'] = extract_domain(row['Email'])
You need to investigate this error to learn more. One way to do this is to use the logs, but you can also inspect and debug this error in Code Studio.
Debugging with VS Code
See if you can find out more by using the VS Code debugger.
From the recipe that
generates contacts_2, select Edit in Code Studio.In Code Studios, select VS Code.
Dataiku displays the VS Code Workspace Explorer ready to debug the recipe. The
project-lib-versionedfolder contains the Python package,my_package. In addition, therecipesfolder contains the recipes.Run the recipe in the debugger.
Open the Recipes folder (
recipes).Select
compute_contacts_2.py.Select Debug Python File.
Running the recipe in VS Code displays the same error you saw in the Flow.
Using the same technique as before, you can spot the error and fix it. For example, you can use the code below for the
extract_domainfunction in the project library. Once you have chosen a fix, the code should run without error.import re def extract_domain(name): split_name = re.split("\.|,",name) if len(split_name) > 1 : return split_name[1] return '(unknown)'
Syncing the changes back to Dataiku
Sync the changes back to the recipe in the Flow.
In VS Code, select Sync Files With DSS in the upper right.
Dataiku synchronises both the recipe and the project library file back to the project. Once the sync is complete, VS Code displays a green checkbox. Verify that the project library file has been updated.
Run the recipe that generates
contacts_2to see that the output dataset is built without exceptions.
Using Code Studio to edit code in a Git reference
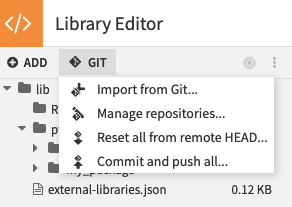
If you have imported code from Git in Dataiku Project Libraries, you will be able to edit this code within Code Studio. Committing the changes made in Code Studio to the Git reference is a 2-step process:
Edit the files in the
project-lib-versionedfolder in Code Studio and click Sync files with DSS.Return to Dataiku Project Libraries and click Commit and push all….
Defining Custom User Settings
By default, VSCode for Code Studio user settings are stored under the user-versioned directory.
For example, if you change the color theme,
it will be saved in /home/dataiku/workspace/user-versioned/settings/code-server/User/settings.json.
If you click Sync File with DSS the VSCode settings.json file will be stored in your user profile
and be applied across all your user code studio sessions.
You can find all the files under the user-versioned directory in your Dataiku User Profile > My Files tab.
Wrapping up
Congratulations, you should now have a functional setup to leverage VSCode for Code Studio allowing you to edit your code in Dataiku as if you were working with your local VSCode.