

Accessing and understanding logs for WebApps#
In this tutorial, we’ll demonstrate how you can leverage logs in your Dataiku Web Applications.
Prerequisites#
Dataiku 14.4 or higher
Optional: Kubernetes cluster
Create a Web Application#
For this tutorial, we’ll be looking at the logs of a Web Application built in Dataiku. But in order to do this, you’ll need to create a Web Application first.
Head over to your project, and on the top menu, under the code (</>) menu item, click on Webapps.
Then click on the New Webapp button on the top-right, and choose Code Webapp.
Choose Standard, then choose Simple web app to get started, enter a name at the bottom of the dialog and then click the Create button on the bottom-right of the dialog.
You’ll now be presented with the code of your newly created Web Application. Click on the Settings tab at the top of the screen and choose Enable Backend. Under “Scalability & Deployment”, make sure the Container section is selected as None. Then click the Save button on the top right.
Check the logs#
After the saving of your settings is completed, your backend should’ve launched as well. To confirm this, head over to the Logs tab at the top of the screen, which should now look something like this.
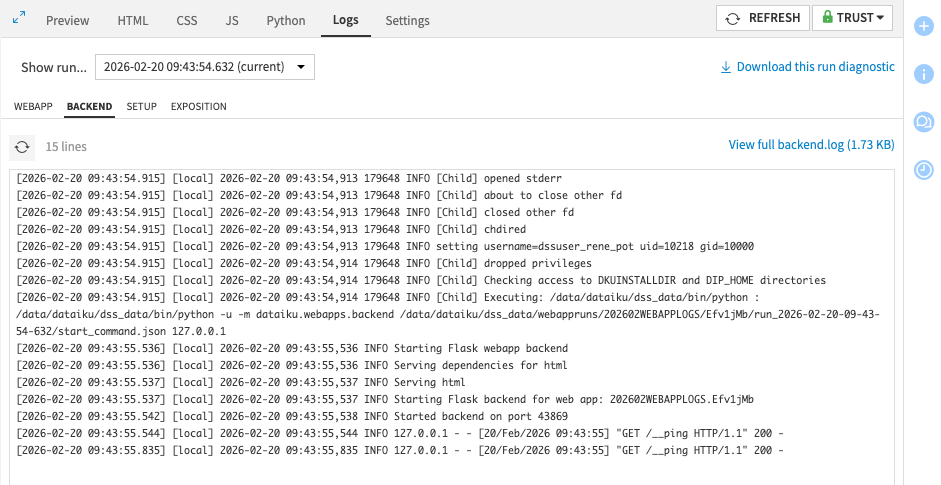
As you can see, you have 4 tabs for logs:
WEBAPP
BACKEND
SETUP
EXPOSITION
The Backend tab logs contain all the logs of your Python backend, and the Webapp tab contains all the logs of your application itself. Of course any logs from your JavaScript code will show up in the browser console under the development tools and not in the logs.
You’ll also note the Setup and Expositon are both empty.
Checking logs in Code Studios#
In Code Studios it is also possible to see split logs. For this, head over to your code studio, click the Logs tab at the top of the screen, and there you will find the logs in a similar way as you see them in Web Application. However, in Code Studios you will only find the following tabs available to you:
BACKEND
SETUP
EXPOSITION
Because Code Studios have “running on cluster” as a prerequisite, all three log tabs will be available from the start.
If you want to know how to create a Code Studio, follow this tutorial: Basic setup: Code studio template
Enabling containers#
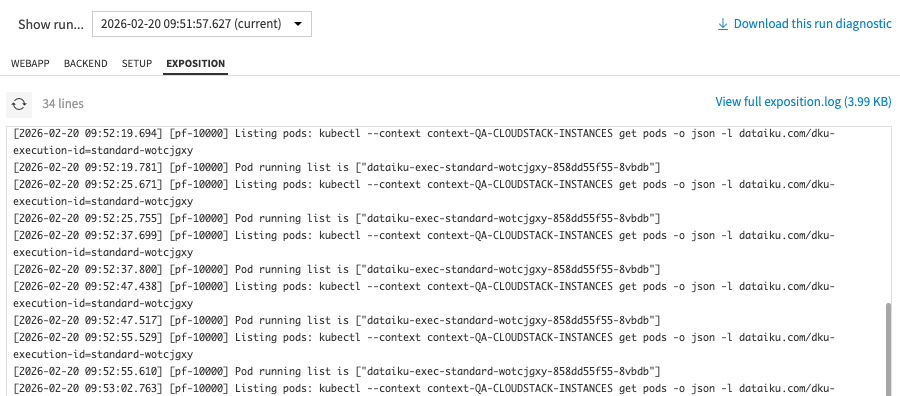
To get logs in the Setup and Exposition tabs, you’ll have to enable “containers”.
Head over to the Settings tab at the top of the screen, and under “Scalability & Deployment”, there’s a Container setting. Choose either Inherit or Select a container configuration to enable running the Web Application on Kubernetes. If you chose “Select a container configuration”, make sure you then actually select a configuration in the dropdown that shows up after you’ve made that selection.
Once your settings are correct, click Save on the top-right of your screen. After the Webapp is done saving, head over to the Logs tab once more, and check if both the Setup and Exposition tabs now have logs defined.
Log History#
Now that you have explored all the log options, it is good to know you can also see the logs of previous runs. As you have been redeploying and re-running the application several times during this tutorial, you should now see several historical runs in your Logs tab. This should look something like this.
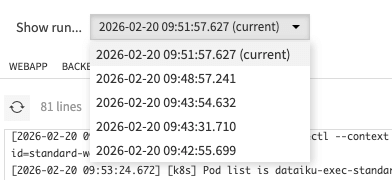
If you click the Show run… dropdown and you return to your first run, you should see the initial run of your Web Application again with both the Setup and Exposition tabs empty again.
This way, you can always explore all the logs of the different runs, and also understand what went wrong in previous runs if you had any errors, this can be especially useful if auto-start has been enabled for a Web Application and you run into errors at that stage.
Conclusion#
Now you know how logs work and behave with Dataiku Webapps. And you know the 4 different logs, as well as the history of previous logs, and how to explore these.